
The purpose of this first exercise was to create a map of the coastal counties of Mississippi that displayed the elevation, places, types of water, barrier islands, and hydrography. This amp allowed for examination of the spatial distribution of features. As can be seen in the map, there is an extensive network of rivers throughout the three counties. There are areas of vast mash networks from central to lower Hancock County and from central to western Jefferson County. A majority of the lower portions of the three counties, including all of the barrier islands, are of low elevation. A majority of the population, as determined by location of places, lies along the coast or within areas of low elevation next to rivers and/or marshes. From this map, it can be hypothesized that due to the overall low elevation, the extensive networks of rivers, and the amount of wetlands, a large storm surge could be devastating to the area. The storm surge itself would cause damage, however, the storm surge will travel up the rivers and into the wetlands and cause massive flooding in the area.

This next image contains data required for both Deliverable 2 and Deliverable 3. The purpose of this exercise was to determine a quantitative analysis through the identification of the land most affected by the storm surge and its land-cover type. The first step in the exercise was to calculate the amount of flooded land. This was done by multiplying the elevation layer by 3.28 to determine elevation in feet. Next, the elevation that was less than or equal to 15 feet was selected to display to extent of flooding. From this a flooded land layer was created. The landcover layer was then added, reclassified, and multiplied by the flooded land layer to create a flooded landcover layer. The flooded landcover layer was then reclassified to display the type of landcover that was flooded. The next step was to create a bar graph showing the percentage of total flooded land by landcover type.

The purpose of this next exercise was to prepare a map showing the spatial distribution of infrastructure and health facilities and determine the extent of damage to the facilities. As can be seen in the map, a majority of the churches as well as every hospital in the area was located along the coastal area. It is believed that the churches and hospitals in the area were all damaged of destroyed by the storm surge. Major highways as well as the barrier island were washed over or destroyed as well. In order to allocate resources there must be a way to get them where they need to be, therefore, the first step in allocating resources to the area would be to clear and restore roads. The next step would then be to restore medical and emergency facilities.
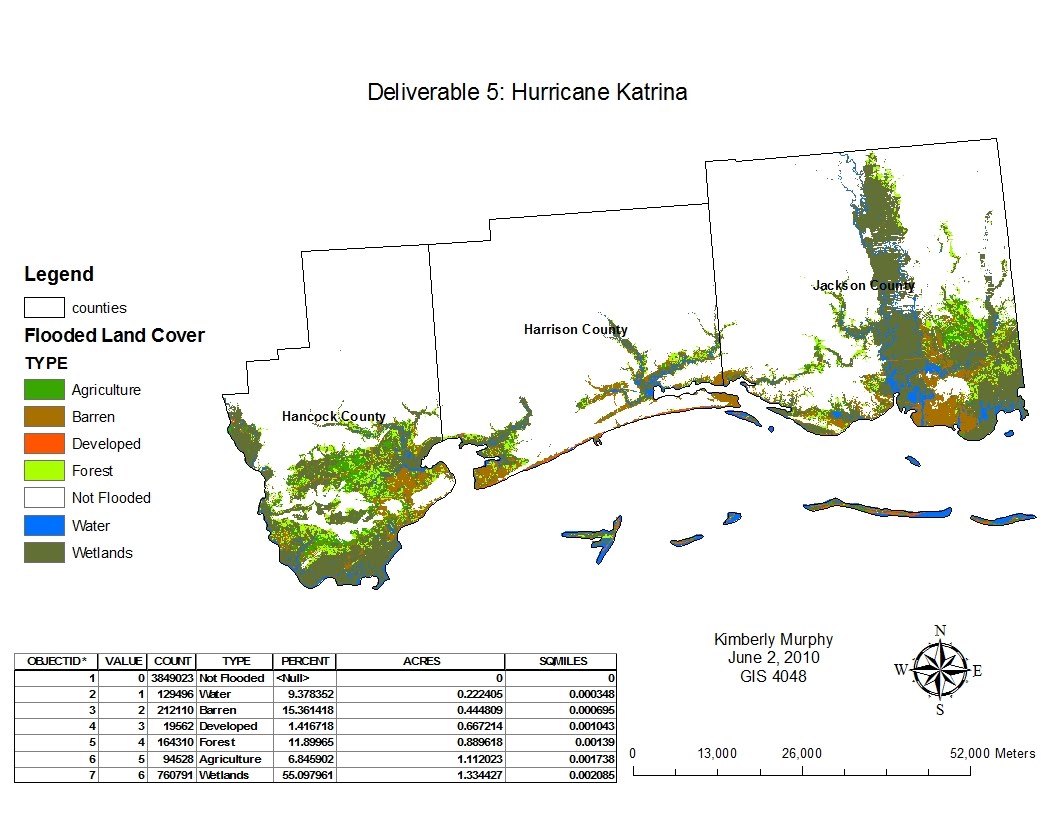 The purpose of this final exercise was to calculate the acres and square miles of the flooded areas. This information allows for damage assessments. This was easily done by adding an acre and square mile field to the flooded landcover attribute table and calculating the fields.


